Infographic · July 2026
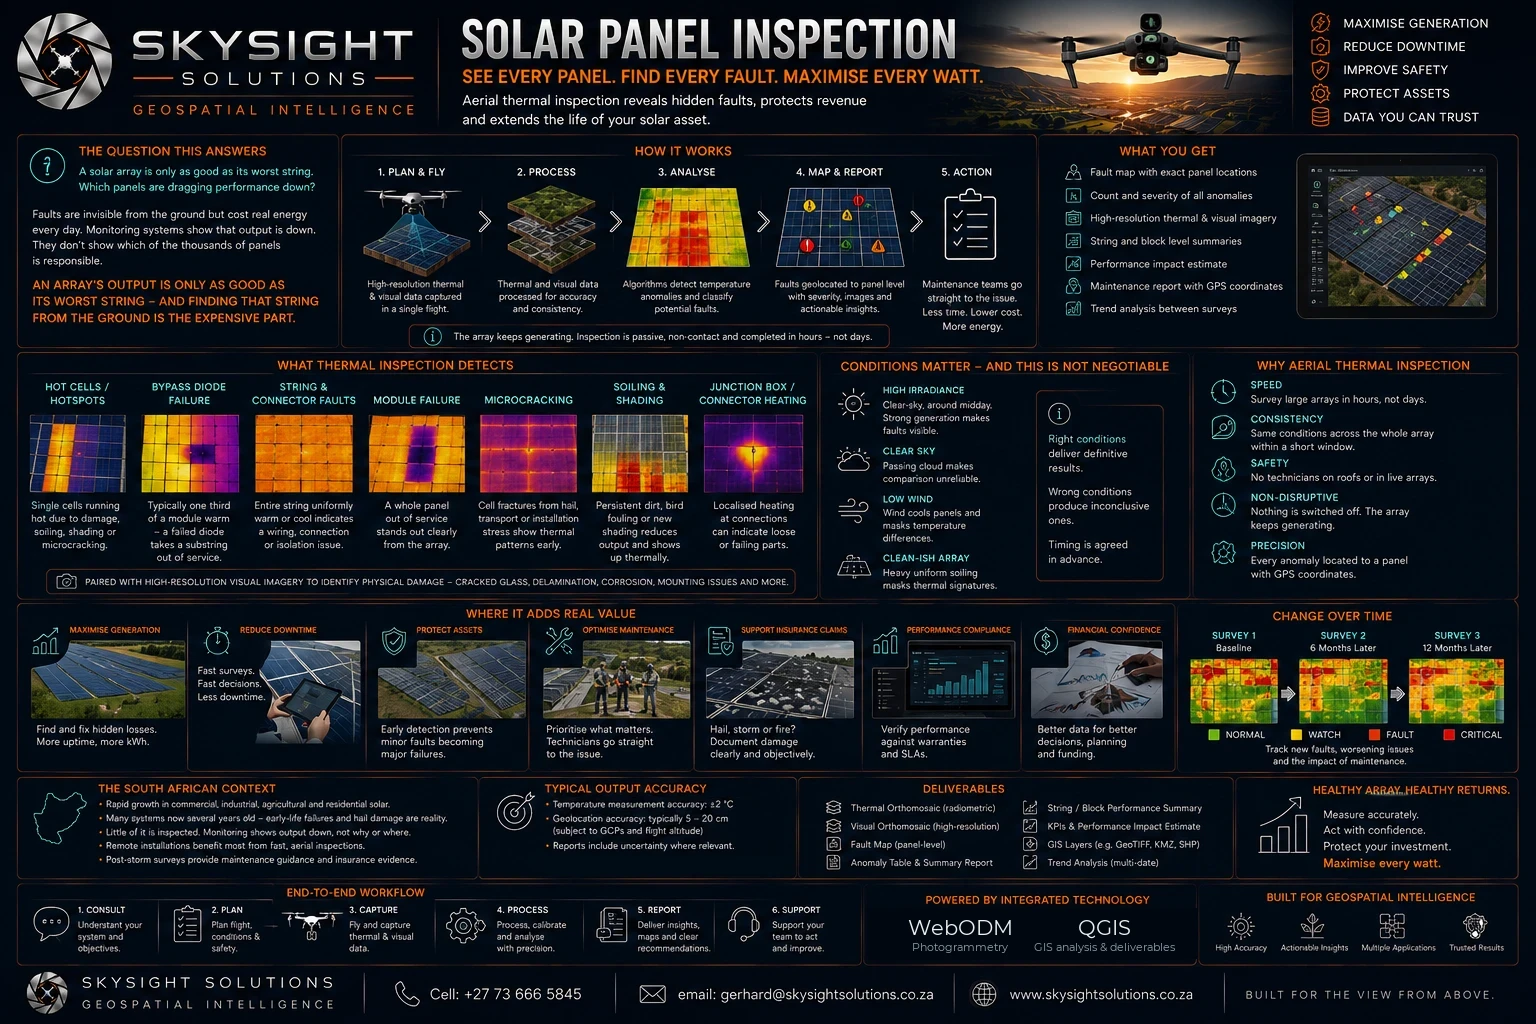
What thermal inspection detects, why survey conditions decide whether the result is definitive or inconclusive, and what an owner receives — a fault map with exact panel locations.
 View full size
Detailed infographic — tap or click the image to open it full size for reading.
Faults in a solar array are invisible from the ground and cost real energy every day. Monitoring systems show that output is down; they do not show which of the thousands of panels is responsible.
An array is only as good as its worst string — and finding that string from the ground is the expensive part.
Thermal inspection detects seven distinct fault types, each with its own signature: hot cells and hotspots from damage, soiling or microcracking; bypass diode failure, where typically a third of a module runs warm because a failed diode has taken a substring out of service; string and connector faults, where an entire string reads uniformly warm or cool; whole modules out of service; cell fractures from hail, transport or installation stress; persistent soiling and new shading; and localised heating at junction boxes and connections.
Conditions decide whether the result is definitive or inconclusive. The array must be generating strongly under clear sky around midday, in low wind, and not heavily soiled — because under weak sun a faulty panel and a healthy one look much the same. Timing is agreed in advance rather than left to the day.
The advantages of doing it from the air are speed, consistency and safety. Large arrays are surveyed in hours rather than days. Every panel is assessed under the same conditions within a short window, which is what makes comparison across the array valid. No technician goes onto a roof or between live strings. And nothing is switched off — inspection is passive and the array keeps generating.
Repeat surveys turn it into trend data: new faults appearing, existing ones worsening, and the measurable impact of maintenance work between one survey and the next.
Want this applied to your own property, site or asset?
Book a Consult