Infographic · July 2026
What can be compared between two surveys, where it earns its keep, and why the first survey matters most of all — turning impressions into evidence.
 View full size
Detailed infographic — tap or click the image to open it full size for reading.
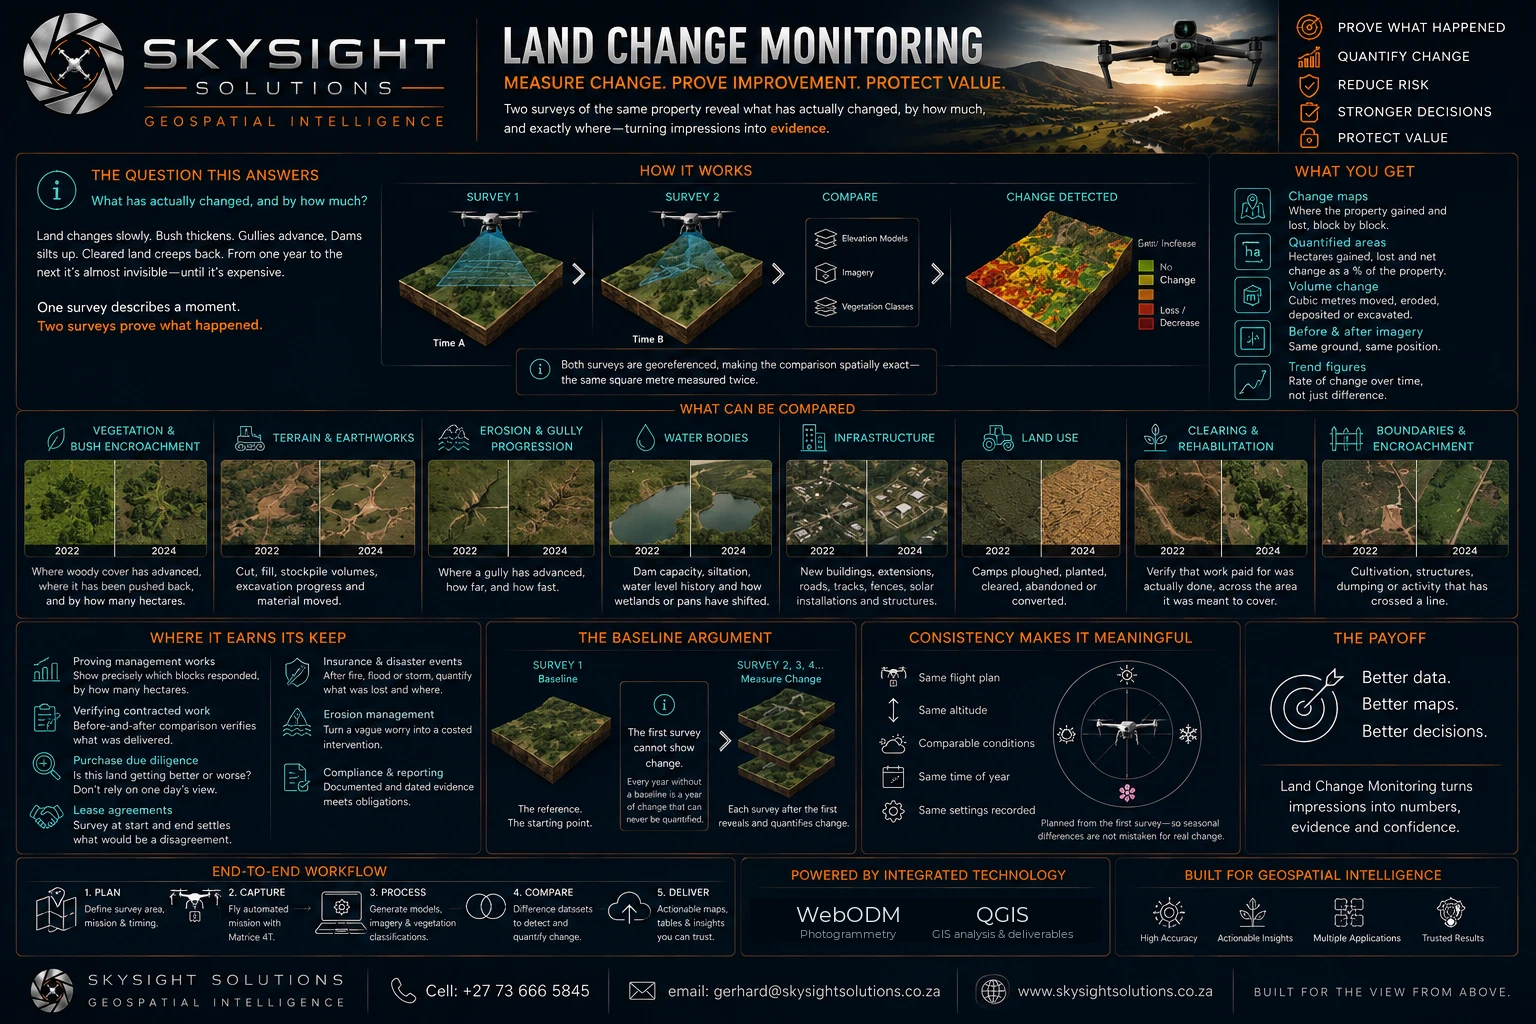
Land changes slowly. Bush thickens, gullies advance, dams silt up, cleared land creeps back. From one year to the next it is almost invisible — until it is expensive.
One survey describes a moment. Two surveys prove what happened.
Eight things can be compared between them: vegetation and bush encroachment, terrain and earthworks volumes, erosion and gully progression, water bodies and dam capacity, infrastructure, land use, clearing and rehabilitation work, and boundaries where cultivation or activity has crossed a line.
Because both surveys are georeferenced, the comparison is spatially exact — the same square metre measured twice, rather than two photographs held side by side. The output is a change map with hectares gained and lost, cubic metres moved, and where three or more surveys exist, a rate of change rather than just a difference.
What makes it meaningful is consistency: the same flight plan, the same altitude, comparable conditions, the same time of year, and the settings recorded — so that seasonal difference is never mistaken for real change.
And the point worth acting on: the first survey cannot show change. It is the reference, the starting point. Every year that passes without one is a year of change that can never be quantified.
Want this applied to your own property, site or asset?
Book a Consult