Knowledge
How aerial survey data answers the questions that matter about land — what is there, how it sits, how water moves across it, and what it is capable of supporting.
The full picture — what a land intelligence survey captures, and what you get back.
 One Drone Flight for Total Farm IntelligenceYou are driving a bakkie across two thousand hectares. You can see the veld, the koppie, the dam in the valley. But seeing is not measuring — and that becomes painfully obvious the second a real financial decision depends on it.Guide
 One Flight, and the Rest Is ArithmeticMost people assume a survey producing eight different outputs must involve eight different pieces of work. It does not. One flight produces one dataset, and everything else is derived from it — which changes how you should buy this.Infographic
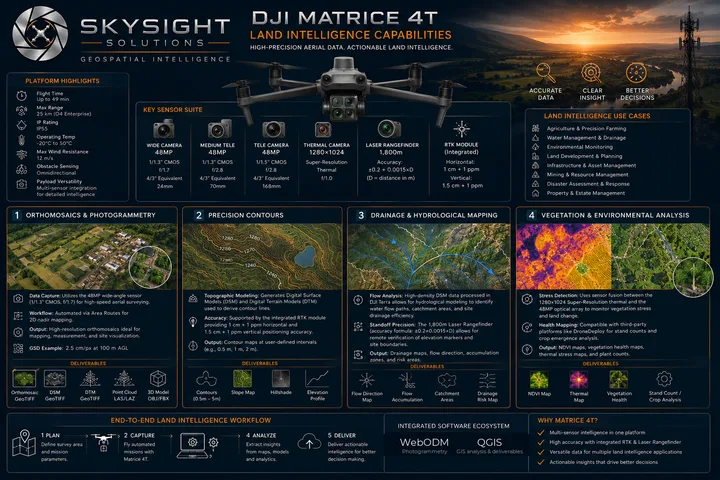 Land Intelligence — What a Survey CapturesOrthomosaics, precision contours, drainage and hydrological mapping, and vegetation analysis — the four pillars of a land survey, with the deliverables each one produces.
Measurable, distortion-corrected aerial maps — and why they are not just photographs.
 Orthomosaic Mapping — A Practical Guide for LandownersWhat an orthomosaic is, how thousands of aerial photographs become a single map you can measure on, what accuracy to expect, and the decisions it answers on a working property.Podcast
 When an Aerial Photograph Isn’t a MapA conversation about the expensive difference between looking at a piece of land and measuring it — why a beautiful drone photograph distorts distance, area and boundaries, and what turns one into something you can actually measure on.Infographic
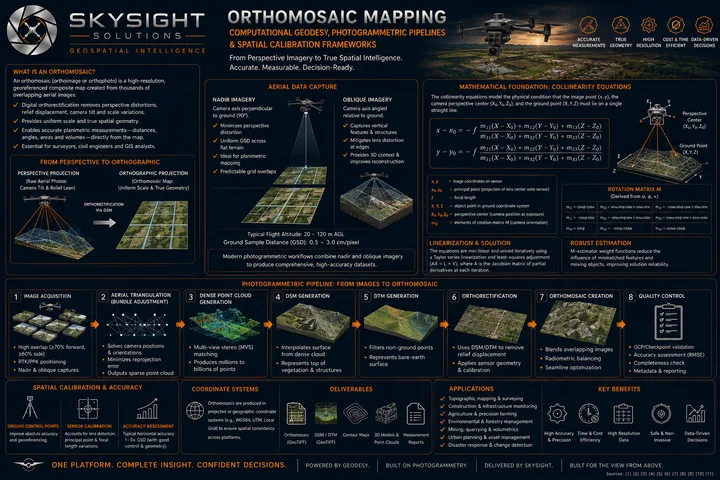 Orthomosaic Mapping — From Aerial Photographs to a Measurable MapWhy an orthomosaic is not simply a large aerial photograph, how thousands of overlapping images become one map you can measure on, and what accuracy you can reasonably expect.
The difference between surface and terrain models, and what each one is used for.
 Surface and Terrain Models — A Practical GuideTwo elevation models that look almost identical on screen, only one of which is the shape of the ground. What each is for, where the difference costs money, and the simple rule that keeps you on the right one.Podcast
 The Invisible Trap in an Elevation MapA quarter of a million rand spent excavating a dam that holds half the water you calculated. An earthworks bill for shifting a thicket of acacia as though it were solid rock. Both come from the same mistake — trusting a map that is not showing you the ground.Infographic
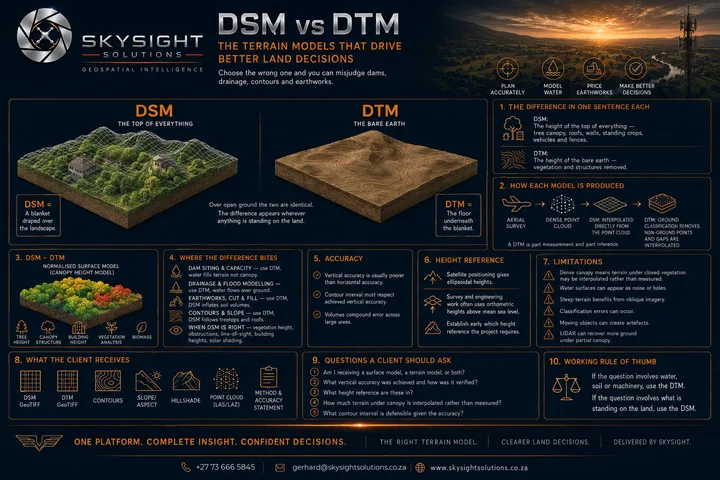 DSM vs DTM — The Terrain Models That Drive Better Land DecisionsBoth look almost identical on screen. Only one is the shape of the ground — and choosing the wrong one can misjudge a dam, route drainage across rooftops, or price earthworks against soil that is actually tree canopy.
Reading elevation and predicting where water collects, flows and pools.
 Mapping Your Farm’s Invisible Water FlowEvaluating a farm on a crisp dry morning in July tells you almost nothing about what happens when the flash floods arrive in February. This is the question you cannot answer on foot.Infographic
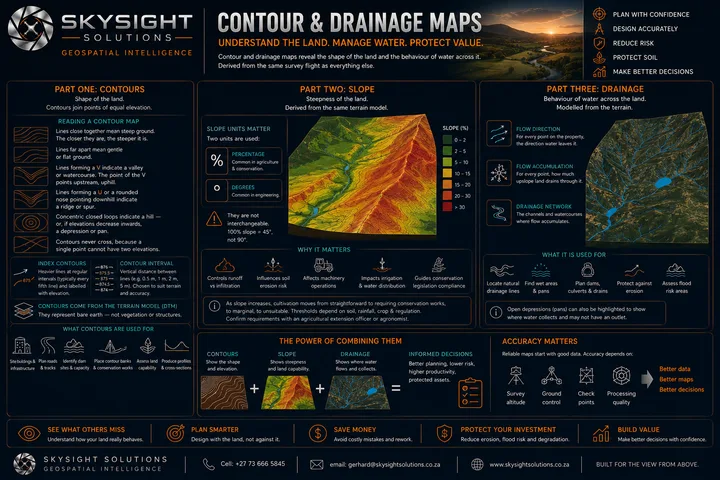 Contour & Drainage Maps — Understand the Land, Manage WaterContours show the shape of the land, slope shows its steepness, and drainage shows where water goes. Together they explain how a property behaves — and what it will cost you if you get it wrong.Guide
 Contours and Drainage — What Your Land Does When It RainsHow to read a contour map, what slope really tells you, and how flow paths and catchments are mapped from terrain — answering the question a buyer cannot answer on foot.
Separating grass, scrub and canopy by height to quantify what is growing where.
 Vegetation Height — Turning “It’s Getting Bushy” Into HectaresHow height classification measures what is growing on your land, band by band, and turns a nagging suspicion about encroachment into a number you can budget, plan and act on.Podcast
 Mapping Bush EncroachmentEvery farmer knows the veld is getting bushier. Almost none can say by how many hectares, how fast, or exactly where. This is about turning that shrug into a number you can budget against.Infographic
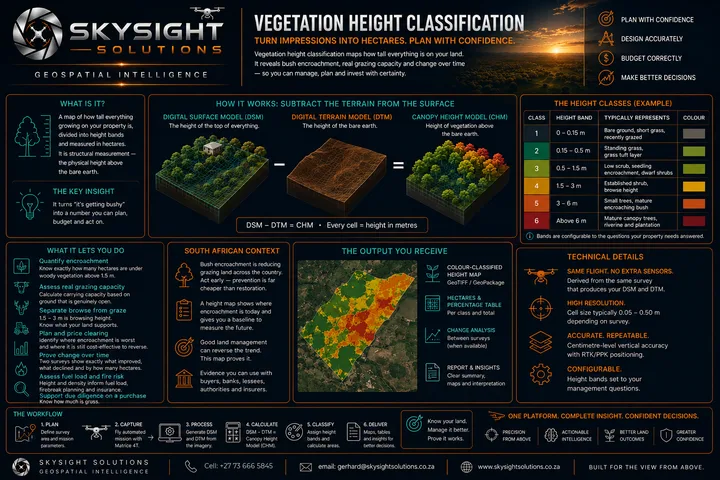 Vegetation Height Classification — Turning Impressions Into HectaresHow tall everything on your land is, divided into height bands and measured in hectares — revealing bush encroachment, genuine grazing capacity, and whether the trend is going your way.
Counting and measuring tree cover across large properties without walking them.
 Precise Tree Counts With Aerial SurveyingYou would not ask a bank for a loan and value your equipment at "around fifty thousand, give or take". Yet that is exactly how most properties account for their trees.Infographic
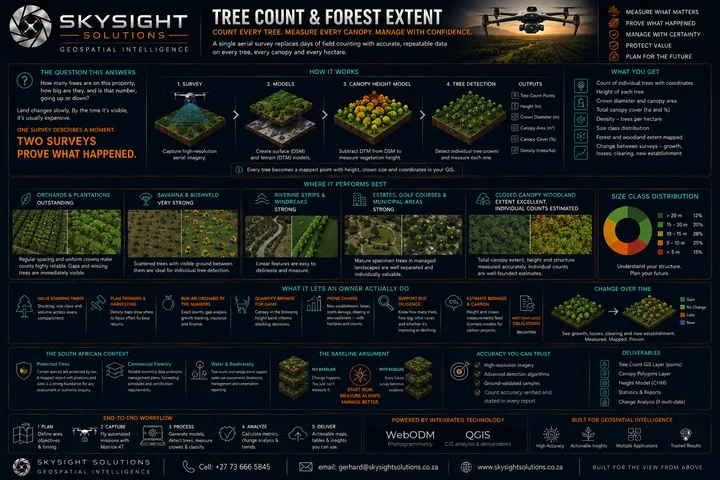 Tree Count & Forest Extent — Count Every Tree, Measure Every CanopyHow individual tree detection works, where it performs best, and what an owner does with a mapped point for every tree carrying its height and crown size.Guide
 Counting Trees From the AirHow many trees are on the property, how big are they, and is that number going up or down? A morning of flying replaces a week of counting — and this is one of the things aerial survey does exceptionally well.
Comparing surveys over time to show what has changed, and by how much.
 Two Surveys Prove Your Land ValueThe owner leans on the bakkie, gestures at the horizon, and says the bush clearing programme is working wonders. It certainly looks good today. If you are the buyer, the agent or the lender — how would you actually know?Infographic
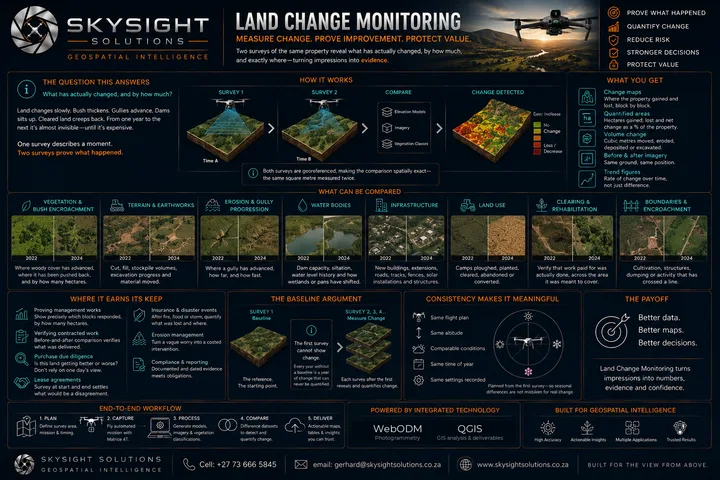 Land Change Monitoring — Measure Change, Prove ImprovementWhat can be compared between two surveys, where it earns its keep, and why the first survey matters most of all — turning impressions into evidence.Guide
 Land Change Monitoring — Proving What Actually HappenedLand changes too slowly to see and too expensively to ignore. One survey describes a moment. Two surveys turn every argument about whether a property is improving into a number.