Infographic · July 2026
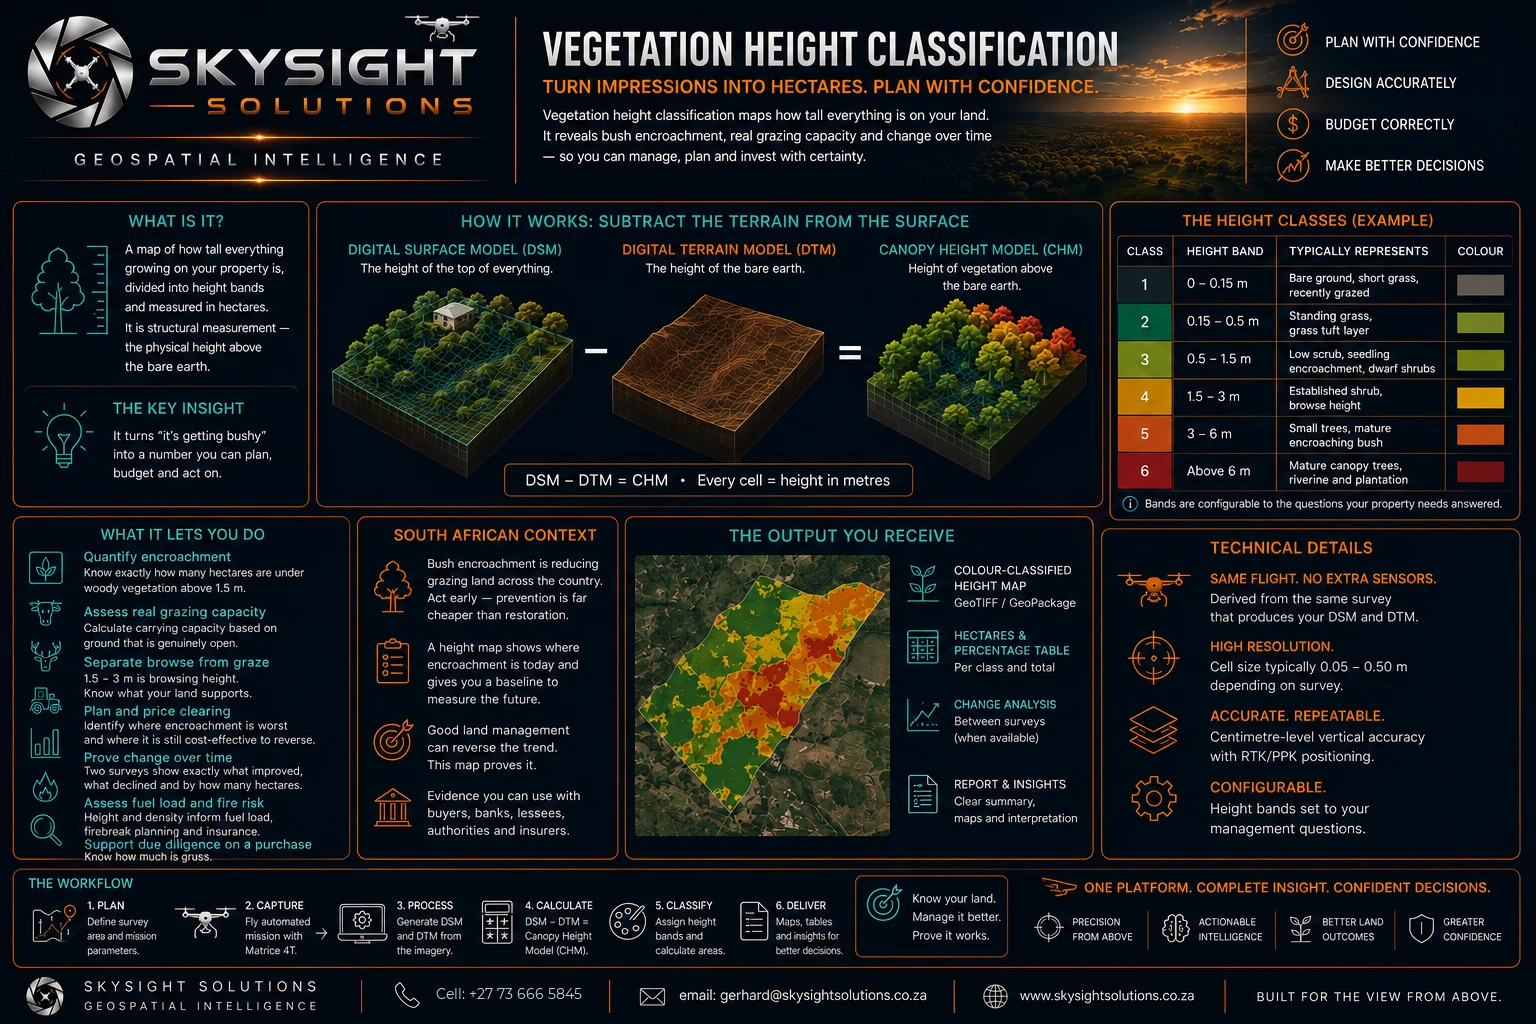
How tall everything on your land is, divided into height bands and measured in hectares — revealing bush encroachment, genuine grazing capacity, and whether the trend is going your way.
 View full size
Detailed infographic — tap or click the image to open it full size for reading.
Vegetation height classification is a structural measurement, not a photograph and not a greenness index. It records the physical height of everything growing above the bare earth, sorts it into bands, and reports the area in each.
It comes from subtracting the terrain model from the surface model. Whatever is left is the height of what is standing there — a canopy height model. No extra site visit and no additional sensor; it is arithmetic on data the same flight already captured.
The height bands are configurable rather than fixed. A cattle operation cares about where grass gives way to shrub. A game operation cares about the browse layer between roughly 1.5 and 3 metres. A forestry assessment cares about the upper classes. The bands should be set to the questions the property needs answered.
What makes it valuable is repetition. One survey describes a moment. Two surveys a year or two apart show precisely which blocks improved, which deteriorated, and by how many hectares — which is evidence you can put in front of a buyer, a bank or a lessee.
Two limits worth knowing. Height does not identify species: a two-metre encroaching shrub and a two-metre useful browse species are indistinguishable by structure alone. And where canopy is dense enough to hide the ground, the terrain beneath is interpolated rather than measured, so heights there are less certain — which is, awkwardly, exactly where encroachment tends to be worst.
Want this applied to your own property, site or asset?
Book a Consult